← Back to whitepapers

White paper · March 2026

White paper — Building a data-driven culture: from POC to industrialization

Building a data-driven culture: from POC to industrialization. 38 pages written from the field — we know where data projects break: rarely on the models, almost always on quality.

  • The six seams of scaling up, and the cost of the perpetual POC
  • Every dataset has an owner: quality treated as debt, and minimum viable governance
  • The data RACI and the rule of thirds for the budget
  • The blind spots: the POC with no user, the dashboard no one looks at, the data lake turned swamp, the isolated data scientist
Cover of the white paper
White paper · March 2026
White paper — Building a data-driven culture: from POC to industrialization

Read the opening pages

The 38 pages of this white paper. The first 11 are readable in full; the rest is sent by email.

Page 1 of the white paper “Data-Driven Culture: From POC to Industrialisation”
Page 1

White paper · March 2026

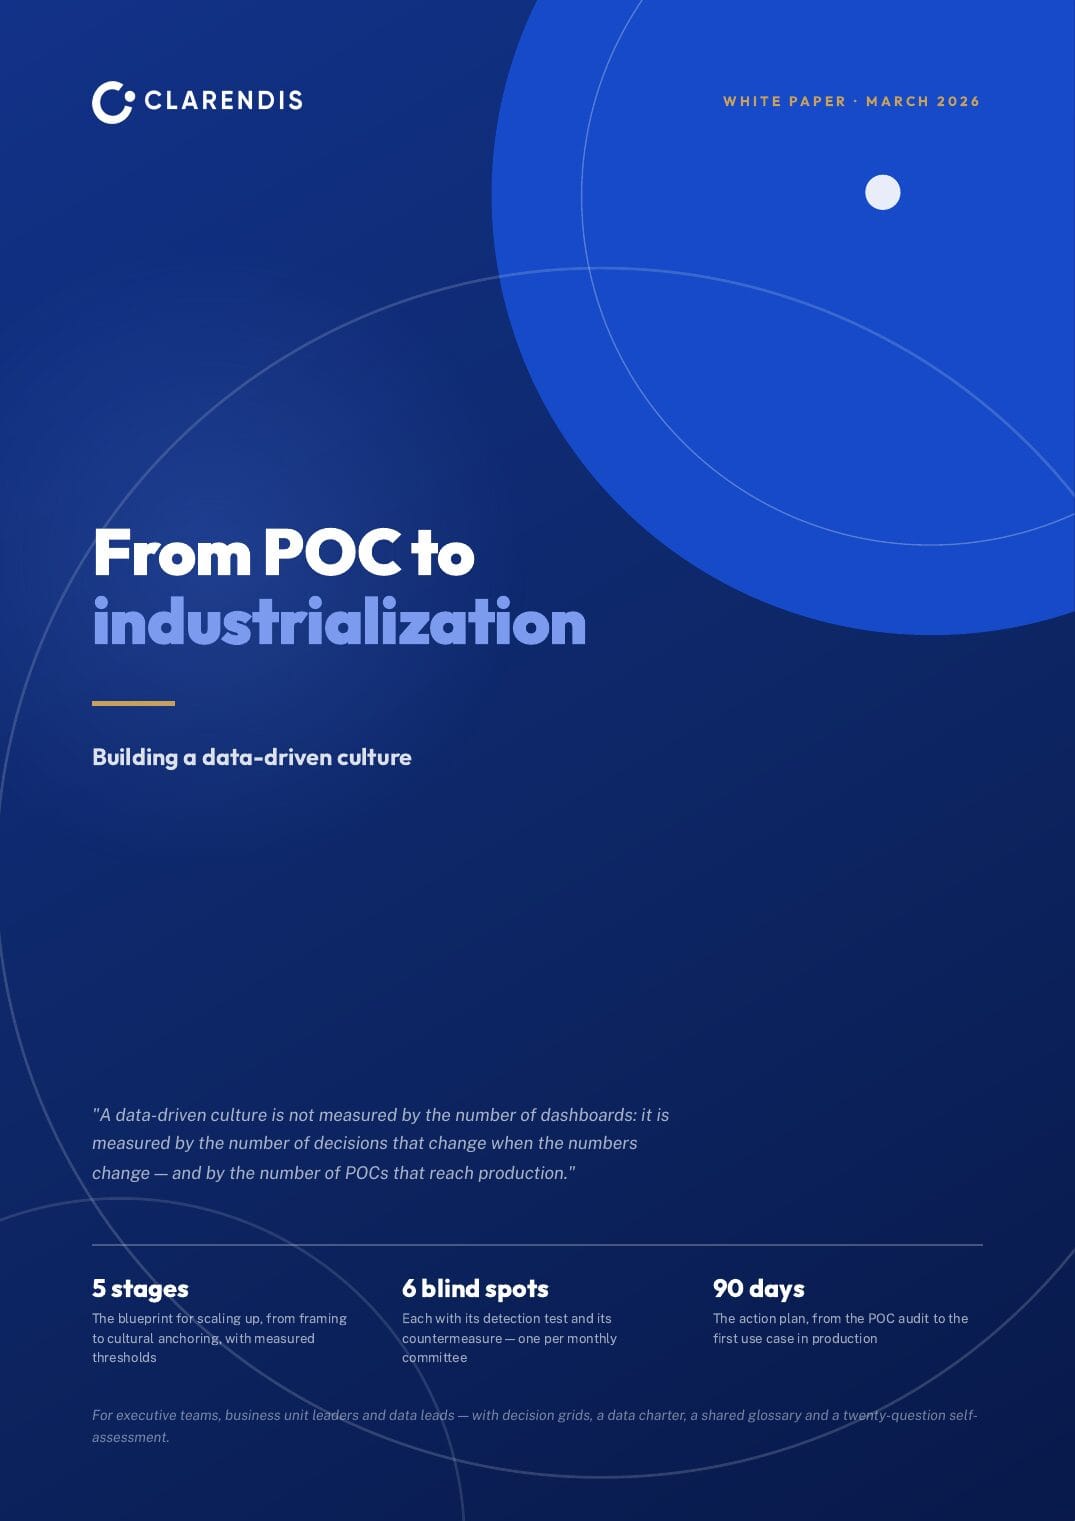
From POC to industrialization

Building a data-driven culture

"A data-driven culture is not measured by the number of dashboards: it is measured by the number of decisions that change when the numbers change — and by the number of POCs that reach production."

5 stages

6 blind spots

90 days

The blueprint for scaling up, from framing to cultural anchoring, with measured thresholds

Each with its detection test and its countermeasure — one per monthly committee

The action plan, from the POC audit to the first use case in production

For executive teams, business unit leaders and data leads — with decision grids, a data charter, a shared glossary and a twenty-question self-assessment.

Page 2 of the white paper “Data-Driven Culture: From POC to Industrialisation”
Page 2

Contents

Foreword 03 Executive summary — the document in ten statements 04 Your reading path 06 1 The POC graveyard A POC is not a product · The six seams of scaling up · The cost of the perpetual POC · Three organizations: the SMB, the mid-market firm, the group 07 2 Data as an asset Every dataset has an owner · Quality is a debt · Minimum viable governance 11 3 The data organization The single accountable lead · Roles and the platform · The data RACI · The budget and the rule of thirds 15

4 From POC to production, step by step Frame by the decision · Prove in real conditions · Industrialize · Operate and adopt · Anchor the culture 19 5 The blind spots The POC with no user · The dashboard nobody looks at · The data swamp · The isolated data scientist · Quality never budgeted · Value never measured 24 6 Deciding without predicting What is certain, what is scenario · The data & AI doctrine · The four no-regret decisions 28 7 The 90-day plan Where do you start from? · The D1-D90 timeline · The five-number dashboard · The 90 days on one page 32 Moving to execution 35 Appendices — Self-assessment and glossary 36

The common thread

A data-driven culture is not built by multiplying POCs: it is built by finishing one — all the way to production, all the way to the decision that changes. This document turns that into a measurable discipline.

Page 3 of the white paper “Data-Driven Culture: From POC to Industrialisation”
Page 3

Foreword

A project review, one Thursday. The sales-forecasting POC is eighteen months old; the demo was brilliant, the committee applauded. Since then: nothing. The data scientist has left, the notebook no longer runs, the sales team still forecasts in their spreadsheet. Next in line, three more POCs are waiting — recommendation, maintenance, scoring. Nothing was wrong: the models were good, the needs were real — it is the path between the demonstration and the daily decision that was never built. The company did not lack data that quarter; it lacked industrialization.

We have sat through too many reviews like that one — often to take over, finish or bury the POCs in question. Hence this document, whose position fits in one sentence: a data-driven culture is first a culture of decision-making, and it is built like a construction site — a POC that goes all the way to production, a dataset that has an owner, a value that gets measured — never like a collection of demonstrations. It can be decided, specified and measured. So you will find material to act on, not to meditate on: a blueprint for scaling up, grids with thresholds, templates to copy as-is (a data charter, a RACI, an AI doctrine), a 90-day plan, a self-assessment. Never a diagnosis without the decision that goes with it.

A point of intellectual honesty: we design, deploy and operate data platforms for our clients — which is precisely why we know where data projects break: rarely on the models, almost always on data quality, missing ownership and adoption that was never led. The grids and thresholds in this document are the ones we accept being held to on our own projects.

How to read this document. The chapters stand alone; page 6 offers a path by role. If you read only eight pages: the executive summary (p. 4-5), the scaling blueprint (ch. 4) and the 90-day plan (ch. 7). The self-assessment on page 36 will tell you where to start.

Enjoy the read — and may your data show up in your decisions, not only in your dashboards.

Cédric Guittard

Anna Hoang

cedric.guittard@clarendis.com

anna.hoang@clarendis.com

for the Clarendis team — March 2026

Page 4 of the white paper “Data-Driven Culture: From POC to Industrialisation”
Page 4

Executive summary

The document in ten statements. Each one is developed, tooled and located in the chapter indicated.

01 A successful POC is not a victory: it is an unkept promise.

02 Scaling up is lost in the seams, not in the models.

A data project's value is born in production, when a daily decision changes. A POC that stops there is a cost — and a precedent. (ch. 1)

Between the POC's data and production data, between the notebook and the pipeline, between the data team and the business — six seams, each with its threshold. (ch. 1, 4)

03 Data without an owner is wrong data — eventually.

04 Data quality is a debt: it gets measured or it accumulates.

Every critical dataset has a named business owner, accountable for its definition and quality. "The data belongs to everyone" means it belongs to no one. (ch. 2)

Freshness, completeness, uniqueness, traceability — four measures, four thresholds, published. Invisible debt is paid at full price, always at the worst moment. (ch. 2)

05 One accountable lead, one shared platform, short governance.

06 You industrialize a decision, not a model.

Framing starts with the question: which decision, made by whom, will change? A use case that can answer is a construction site; the others are demonstrations. (ch. 4)

A name — not a committee — carries the data strategy and reports monthly on five numbers. The rule of thirds protects the budget: platform, use cases, quality & enablement. (ch. 3)

Page 5 of the white paper “Data-Driven Culture: From POC to Industrialisation”
Page 5

07 The dashboard is not the culture: the tooled decision is.

08 An isolated data team produces POCs; an integrated one produces value.

A dashboard nobody looks at is a POC that managed to disguise itself as production. The measure that counts: how many recurring decisions rest on data? (ch. 5)

The data scientist who never meets the user optimizes what does not matter. Every use case ships with a business counterpart, from framing to production. (ch. 3, 5)

09 Generative AI does not exempt you from data culture: it depends on it.

10 90 days are enough to prove it — on a single use case.

Clean, cataloged, governed data: the prerequisite AI amplifies — in both directions. The doctrine is written now, on one page. (ch. 6)

See clearly (D1-D30), frame and choose (D31-D60), put into production and measure (D61-D90): the chapter 7 plan, with dated deliverables and its five numbers. (ch. 7)

What this document is not

Not a tool comparison (platforms change, principles remain), not a data science course, not a plea for "more data". It is a scaling manual: how an organization that already has POCs, spreadsheets and convictions turns all of that into tooled decisions, in production, with measured value.

The rule that runs through this document: for any data project, a single question filters everything — which decision, made by whom, will change when this project is in production, and how will we know? A project that can answer is a construction site; a project that cannot is a demonstration.

Page 6 of the white paper “Data-Driven Culture: From POC to Industrialisation”
Page 6

Your reading path

The chapters stand alone. Depending on your role, here is the shortest path to what concerns you — and the first action that follows.

Executive team

Summary (p. 4-5) → ch. 1 → ch. 3 → ch. 7. The POC graveyard will tell you where the money goes; the organization will tell you who must carry it; the 90-day plan will tell you what to decide.

45 minutes of reading

First action: ask for the list of POCs from the last three years, with their status — the table on p. 9 fills itself in one meeting.

Business unit leaders

Ch. 2 → ch. 4 → ch. 5. Data as an asset concerns you first: you are the owner. The blueprint shows your place at every stage; the blind spots, what happens when the business steps back.

40 minutes of reading

First action: for your three most-used indicators, write down the exact definition — if two departments get two numbers, p. 12 is for you.

Data / IT lead

Ch. 3 → ch. 4 → ch. 6, then everything else. The RACI and the rule of thirds are your negotiation tools; the blueprint is your contract with the business; the AI doctrine, your shield against the demo race.

Full read recommended

First action: measure the four quality indicators on p. 12 for your most critical dataset — publish the result, even a bad one.

You only have 20 minutes

Summary (p. 4-5) → blueprint (p. 20-21) → the 90 days on one page (p. 34) → self-assessment (p. 36). Four stops, one decision at the end: your first use case to industrialize, and who carries it.

The bare essentials

Page 7 of the white paper “Data-Driven Culture: From POC to Industrialisation”
Page 7

Chapter 1

The POC graveyard

1

Your POCs know how to demonstrate; it is the path from demonstration to daily decision that gets lost. This chapter replaces "doing data" with a measurable discipline — industrialization — quantifies what the perpetual POC costs you, and locates your organization among three archetypes.

1.1 A POC is not a product

The debate — "should we exploit our data?" — is behind us; the misunderstanding persists. A POC proves that something is possible; a product makes it happen, every day, for the people who decide. In between: production data that looks nothing like the POC's extract, a pipeline to make reliable, a business team to bring on board, a value to measure. The model is the scenery of a data project; industrialization is the plot.

The misunderstanding begins when the POC gets a budget and the rest gets improvised: the production rollout "to be seen later", adoption in a single demo, data quality on trust. Industry barometers have documented it for a decade — the large majority of data and AI projects never reach production, and the dominant cause is almost never the model: it is ungoverned data, missing ownership, the user never involved (Gartner and the major consultancies' data barometers, consistent on this point). The good news: those causes can be managed.

The rule that runs through this document. For any data project, a single question filters everything: which decision, made by whom, will change when this project is in production — and how will we know? A project that can answer is a construction site; a project that cannot is a demonstration — and a demonstration transforms nothing.

Page 8 of the white paper “Data-Driven Culture: From POC to Industrialisation”
Page 8

1

Chapter 1 — The POC graveyard

1.2 The six seams of scaling up — translated into thresholds

"Industrialize" cannot be decreed. What can be managed: the handoffs between the demonstration and the daily decision, and the threshold below which each one breaks. Here is the grid we recommend attaching to every use-case file — each row is a seam, and the right column the threshold to demand:

The seam

The requirement, plainly stated

The threshold to demand

Idea → framing

The use case names the target decision, its decision-maker and the expected value — before any line of code

Decision, decision-maker and value metric written on one page

POC data → real data

The POC works on production data, with its gaps and duplicates — never on a hand-cleaned extract

100% of POC data drawn from real flows

Notebook → pipeline

The processing runs on its own, monitors itself, alerts when it breaks — and someone is named to answer the alert

Automated, monitored pipeline with a named run owner

Data team → business

A business counterpart joins the framing, tests every iteration, signs off the production release — not a final demo

Business counterpart named at framing, present at every review

Release → usage

Real usage is measured, and the tool that goes unused is fixed or stopped — the team is not blamed

Active usage ≥ 70% of target decision-makers at 60 days, measured, published

Usage → value

The gain is quantified against the framing metric and told by the business itself — not by the data team

1 quantified proof told per quarter, per use case in production

How to use it. Measure each seam on your latest POC (a week of interviews is enough), display the gaps, and make this grid the annex of every new file — data vendors included. A failed seam is not a technology problem: it is scaling coming undone in silence, and it is treated at that level.

Page 9 of the white paper “Data-Driven Culture: From POC to Industrialisation”
Page 9

1

Chapter 1 — The POC graveyard

1.3 What the perpetual POC costs — a calculation to redo at home

An abandoned POC does not cost "one attempt" — it costs expert days gone into demos, decisions made on instinct despite available data, and hours lost re-keying and reconciling numbers by hand. Three leaks can be quantified in one day of analysis, with your own data; here is the method:

1

The abandoned POCs

List the POCs of the last three years; mark the ones in production. For the rest, add up person-days, licenses and vendors. It is the easiest number to produce — and the least painful, because it is the only visible one.

2

Data craftwork

Manual extracts, copied spreadsheets, numbers reconciled the night before the committee: time a week in three departments; multiply. It is the most expensive and most normalized leak — it passes for normal work.

3

The eroded data credit

Every POC without a future makes the next one harder to sell: more business skepticism, more departures among data profiles, more "we already tried that". Count the POCs abandoned in three years — that is the multiplier on your next budget.

The perpetual POC's P&L — illustrative 250-person mid-market firm, over 3 years

Data craftwork

€540k

Abandoned POCs

€310k

Eroded data credit

€170k

Orders of magnitude reconstructed with the method above — your data will give your amounts; that is precisely the exercise.

Our recommendation: run this calculation before any new POC, and present it to the committee as above — three leaks, three amounts, an industrialization plan facing them. It is the document that turns "we should be more data-driven" into a dated decision.

Page 10 of the white paper “Data-Driven Culture: From POC to Industrialisation”
Page 10

1

Chapter 1 — The POC graveyard

1.4 Three organizations: the SMB, the mid-market firm, the group

The blueprint in this document is the same for everyone; the starting point is not. Three archetypes — recognize yours, and read the line that goes with it:

The spreadsheet-king SMB

20-100 people

The data exists — in fifteen spreadsheets and three people's heads. No POC, no data scientist, and that is a strength: nothing to undo. The trap would be to start with the platform.

Your path: one single source of truth for three vital indicators (sales, margin, cash), one weekly ritual that reads them, one owner per number. Culture first, tooling as needed — ch. 4 can be read in its simplified version.

The mid-market firm with orphaned POCs

100-1,000 people

Rich business systems, a first data warehouse, two or three POCs nobody mentions anymore, an analyst drowning in extract requests. Leadership believes in data; the organization does not follow yet.

Your path: the core audience of this document. A named data lead (ch. 3), the audit of existing POCs (ch. 7), one single use case industrialized end to end — and the ch. 4 blueprint applied to the letter.

The group with siloed data

1,000+ people

A data team exists, the platform too — but every subsidiary has its definitions, every department its reporting, and the same indicator gives three numbers depending on who computes it. The problem is no longer technical: it is political.

Your path: data ownership (ch. 2) and the RACI (ch. 3) before any new use case — then a shared reference, indicator by indicator, starting with the one that causes the most committee friction.

What all three have in common: none of them lacks data. All of them lack the organized path between data and decision — and that path is built in the same order, whatever the size: an owner, a use case, a proof.

© Clarendis — March 2026 edition 10

Page 11 of the white paper “Data-Driven Culture: From POC to Industrialisation”
Page 11

Chapter 2

Data as an asset

2

An asset has an owner, a value, an upkeep. This chapter applies all three to your data: who answers for each critical dataset, how its quality is measured in four numbers, and what minimal governance suffices — one page of rules, not one more committee.

2.1 Every critical dataset has an owner — a name, not a department

The test happens in committee, in thirty seconds: take your most debated indicator — revenue per customer, service rate, cost price — and ask who answers for its definition and its accuracy. If the answer is "IT", "management control" or silence, the data has no owner. And data without an owner drifts: definitions diverge, corrections never reach the source, and every department ends up maintaining its own version of the truth.

A dataset's owner is always a business manager — the one whose activity produces the data and depends on it. They do not do the technical work: they answer for the definition (one, written), the entry rules, and arbitrate when two uses contradict each other. IT and the data team are their operators, never their substitutes. The list fits on one page: ten to twenty critical datasets cover most of a mid-market firm's decisions.

The template to copy — the ownership sheet, five lines:Data: margin per deal. Owner: sales director. Definition: [one sentence, only one]. Source of truth: the ERP, sales module. Arbitration rule: any divergence is settled by the owner within 15 days, and the correction is made at the source — never in the reporting.

© Clarendis — March 2026 edition 11

The remaining 27 pages are in the complete document.

Download the white paper
Page 12, blurred — available in the full document
Page 12 · in the full document
Page 13, blurred — available in the full document
Page 13 · in the full document
Page 14, blurred — available in the full document
Page 14 · in the full document
Page 15, blurred — available in the full document
Page 15 · in the full document
Page 16, blurred — available in the full document
Page 16 · in the full document
Page 17, blurred — available in the full document
Page 17 · in the full document
Page 18, blurred — available in the full document
Page 18 · in the full document
Page 19, blurred — available in the full document
Page 19 · in the full document
Page 20, blurred — available in the full document
Page 20 · in the full document
Page 21, blurred — available in the full document
Page 21 · in the full document
Page 22, blurred — available in the full document
Page 22 · in the full document
Page 23, blurred — available in the full document
Page 23 · in the full document
Page 24, blurred — available in the full document
Page 24 · in the full document
Page 25, blurred — available in the full document
Page 25 · in the full document
Page 26, blurred — available in the full document
Page 26 · in the full document
Page 27, blurred — available in the full document
Page 27 · in the full document
Page 28, blurred — available in the full document
Page 28 · in the full document
Page 29, blurred — available in the full document
Page 29 · in the full document
Page 30, blurred — available in the full document
Page 30 · in the full document
Page 31, blurred — available in the full document
Page 31 · in the full document
Page 32, blurred — available in the full document
Page 32 · in the full document
Page 33, blurred — available in the full document
Page 33 · in the full document
Page 34, blurred — available in the full document
Page 34 · in the full document
Page 35, blurred — available in the full document
Page 35 · in the full document
Page 36, blurred — available in the full document
Page 36 · in the full document
Page 37, blurred — available in the full document
Page 37 · in the full document
Page 38, blurred — available in the full document
Page 38 · in the full document
Share this white paper