
Impact Tracking & Reporting
Associations operate under constant tension between fieldwork and the obligation to justify every euro received. Foundations, local authorities, European funds: each funder has its own reporting requirements, formats, and deadlines. In the field, teams collect data in challenging contexts: emergency interventions, rural areas, vulnerable populations.
This data arrives piecemeal: paper forms, WhatsApp, shared spreadsheets, sector-specific applications that don’t communicate with one another. At year-end, the administrative manager spends weeks manually consolidating data to produce impact reports. The risk is twofold: losing funding due to lack of convincing evidence, or exhausting teams with administrative tasks to the detriment of the social mission.
Small organisations don’t have a dedicated management controller. Large ones juggle dozens of programmes with different indicators. In both cases, the question remains the same: how does one prove impact without devoting disproportionate time to it?
This solution belongs to the Data, Master Records & Reporting family.

Challenges holding back your performance
Excel remains the default tool. Each project manager maintains their own file, with their own naming conventions, fragile formulae, and data that becomes desynchronised the moment it’s copied. When the time comes for review, gaps emerge: a particular indicator hasn’t been tracked, a certain branch changed their counting methodology mid-year. General business intelligence tools exist, but they require clean and structured data: which is never the case.They also require technical skills that charities lack internally.Result: approximate reports are produced, delivered late, which don’t reflect the reality of the work accomplished. Funders receive static PDFs whilst they increasingly expect tangible and verifiable proof of impact.
Our Technical Approach
Our approach begins by mapping what you actually measure: not what you would like to measure. We identify data that already exists within your tools, data that is missing, and data that is collected but remains unexploited.
We then build an aggregation layer that respects the reality of your sources: manual imports for some, automatic connections for others, simplified mobile input for field work. Indicators are defined with you, aligned with your principal funders’ requirements. Each KPI has an identified source, a documented calculation method, and a realistic update frequency.
Reports are generated on demand, in the formats expected by each funder. A shared dashboard visualisation tool enables programme managers to monitor progress without waiting for annual consolidation.
The objective is not to automate everything, but to make reliable what can be made reliable and to free up time for qualitative analysis.
Multi-source aggregation
Generation of dynamic reports
Bespoke key performance indicators (KPIs)
Technical Architecture
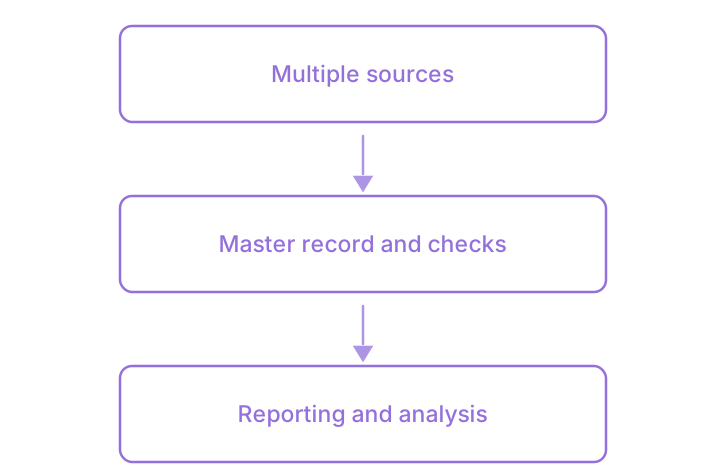
Several sources, one master record to arbitrate between them, then analysis: Observatories & Open Data and Batch Traceability & Genealogy stem from this same chain.
- Multi-source aggregation
- Generation of dynamic reports
- Bespoke key performance indicators (KPIs)
Smooth and frictionless integration
We start from your current tools, not from a blank sheet. Your existing spreadsheets become connected data sources, not files to be abandoned. If you already use a voluntary sector CRM, a field monitoring tool or a legacy Access database, we build the necessary bridges.
The objective: that teams continue to work as they know how to do, whilst consolidation takes place in the background. No massive training, no abrupt change in habits.
Audit of existing data flows
Inventory of your current sources, identification of gaps and duplicates, mapping of requirements by funder.
Definition of the indicator framework
Construction with your teams of a shared KPI dictionary, with calculation methods and documented sources.
Implementation of aggregation
Connection of sources, creation of automated or simplified imports, initial operational dashboards.
Deployment and autonomy
Training of focal points, process documentation, adjustments following a complete first reporting cycle.
Measurable results for your organisation
- Annual report production time reduced from 3 weeks to 3 days for an organisation with 40 employees
- Compliance rate with funder requirements increased from 70% to 95% within the first year
- Detection of indicator variances during the year, not at year-end
- Ability to respond to a funder audit within 48 hours with sourced data
- Reduction in back-and-forth correspondence with funders regarding supporting documentation by 60%
- Real-time visibility on programme progress for department directors
Clarifying your decision-making
Our field teams are already struggling to complete the current tools. How can we avoid an additional layer?
Data collection is simplified rather than another tool added. If your teams already use a mobile messaging app to report information, Clarendis starts from there. The aim is to reduce field entry time, and data consolidates without re-entry.
Our funders each have their own indicators and formats. How do we manage this diversity?
A unified database of source indicators feeds funder-specific views. A single field figure supplies several reports in different formats. You maintain one source of truth, adapted to each party’s requirements.